![]()
Home
Mission
Overview of Project
Project Staff
Sponsors
Achievements
Checking, Illustrations
Upcoming Activities
Id and Species Lists
Protea Information
Protea Gallery
Growing Proteas
Interim Dist. Maps
Publications
Afrikaanse Inligting
![]()
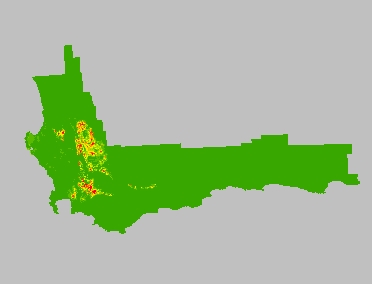
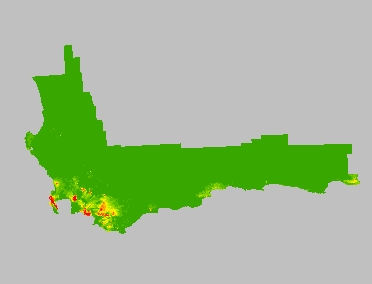
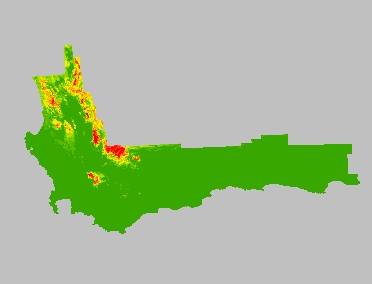
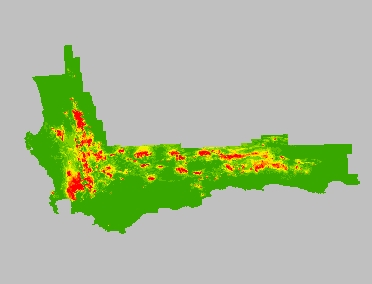
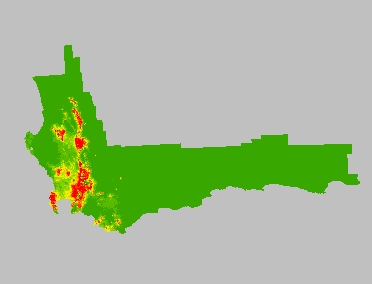
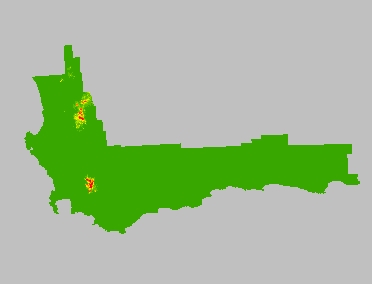
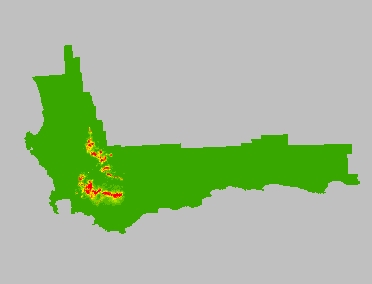
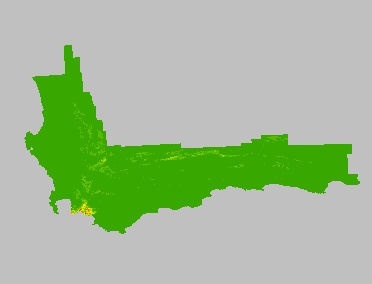
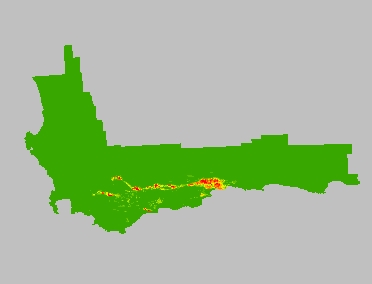
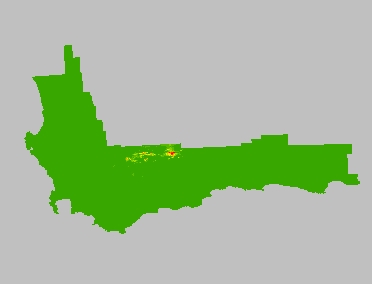
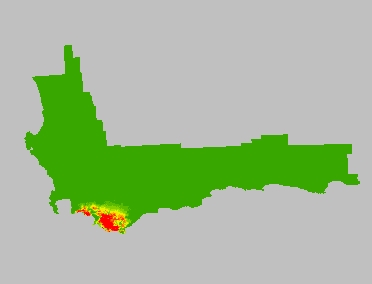
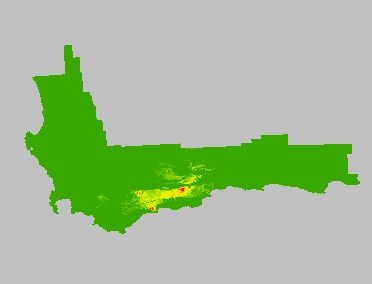
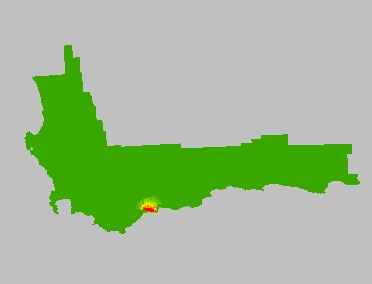
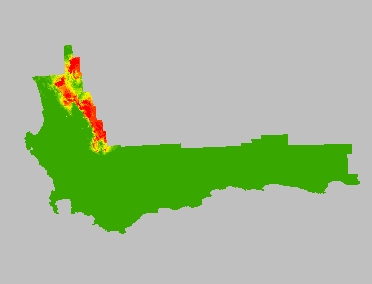
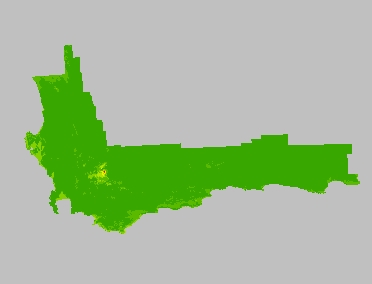
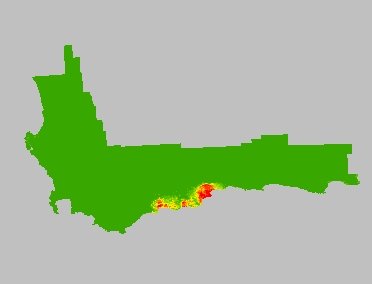
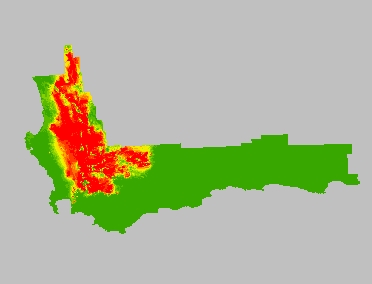
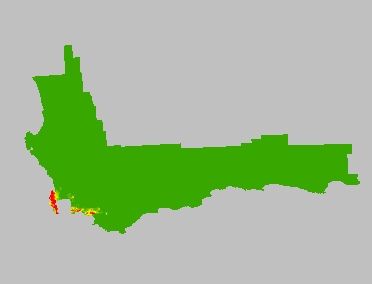
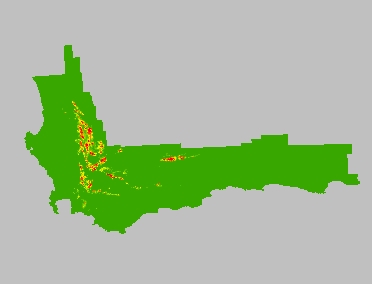
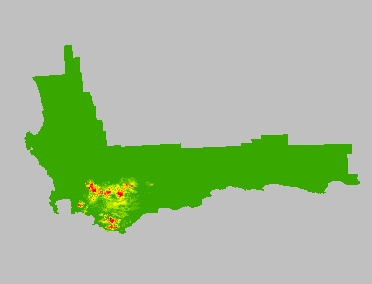
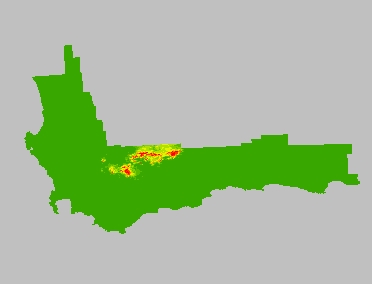
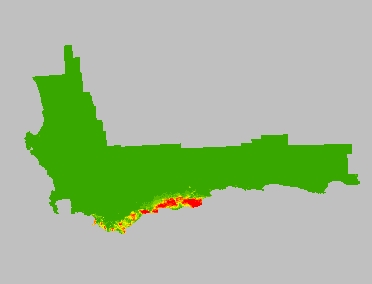
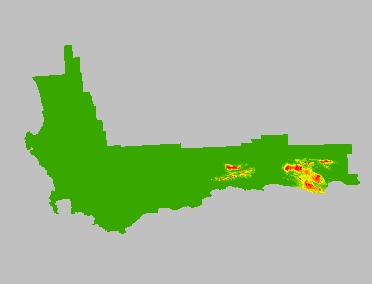
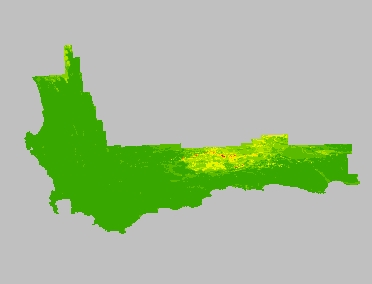
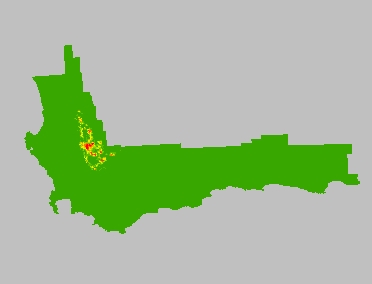
Bayesian modelling - Predicting where proteas occur naturally
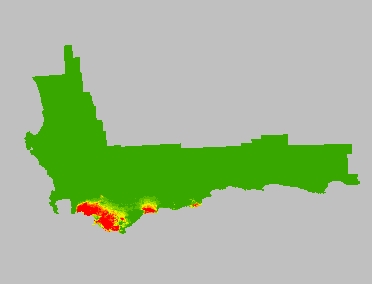
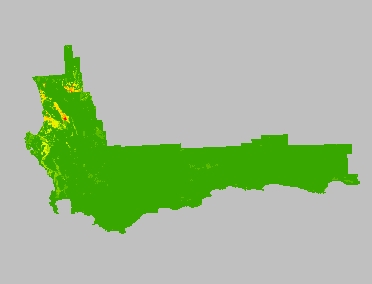
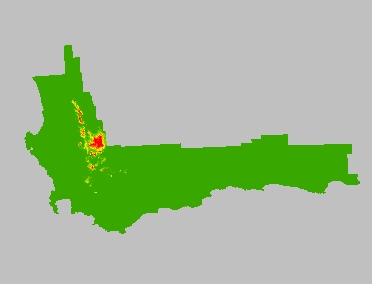
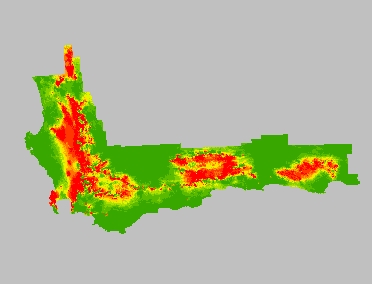
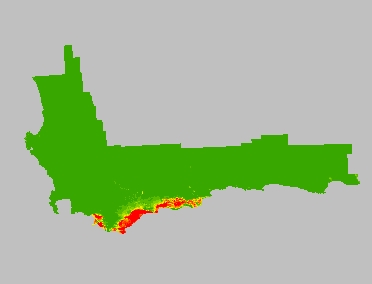
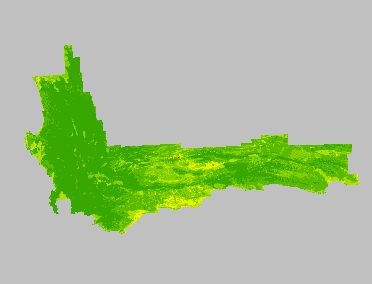
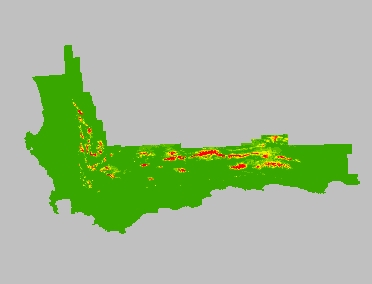
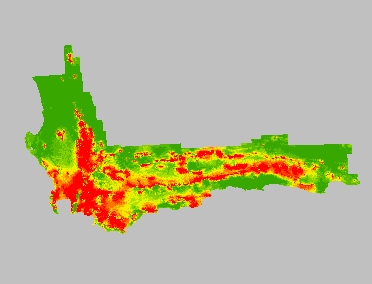
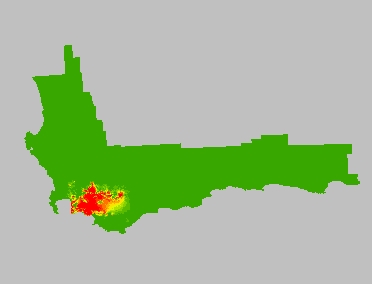
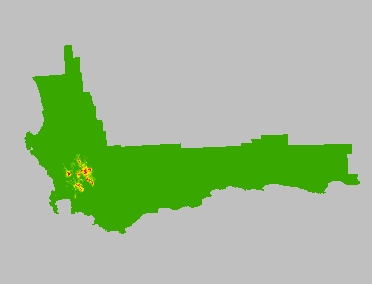
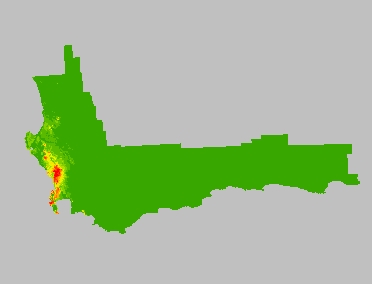
For each map the probability of a species presence is mapped on a scale from green (very low) to red (very high). There are 10 shades shown each of about 10%, but sometimes the intervals are lower as the upper limit is the highest level of prediction for the species. Some species have a high prediction (almost 100%), whereas some rarer species are poorly predicted. The highest level of prediction is given below as a percentage.
Not shown is the varience (or uncertainty) of the predictions - these are available for each species. Usually the "funny areas" have a high uncertainty. Also, poorly predicted species usually have a high uncertainty as well - in these cases it is only by comparing the probability versus the variability that a reasonable picture of distribution can be achieved.
Aulax cancellata 90.5%
Aulax pallasia 95.4%
Aulax umbellata 99.8%
Brabejum stellatifolium 99.8%
Diastella fraterna 97.1%
Diastalla myrtifolia 61.6% - not very high but a good map!
Diastalla thymelaeoides 98.8%
Hakea drupacea 98.3%
Hakea gibbosa 95.5%
Leucadendron album 99.2%
Leucadendron arcuatum 98.8%
Leucadendron argenteum 99.3%
Leucadendron barkarae 87.9%
Leucadendron bonum 76.3% - not too good!
Leucadendron brunioides 97.1%
Leucadendron burchellii 56.0% - not very good!
Leucadendron cadens 94.0%
Leucadendron conicum 99.7%
Leucadendron flexuosum 59.5% - not a good prediction!
Leucadendron laureolum 99.92%
Leucadendron modestum 99.9%
Leucadendron muirii 98.0%
Leucadendron nervosum 75.5%
Leucadendron rubrum 99.5%
Leucadendron salignum 100.0% - top that!
Leucadendron xanthoconus 99.8%
Protea acaulos 99.8%
Protea acuminata 94.2%
Protea amplexicaulis 98.8%
Protea angustata 94.6%
Protea aristata 86.4%
Protea aurea 95.0%
Protea caespitosa 97.5%
Protea canaliculata 98.3%
Protea convexa 90.6%
Protea cordatum 93.4%
Protea coronata 99.6%
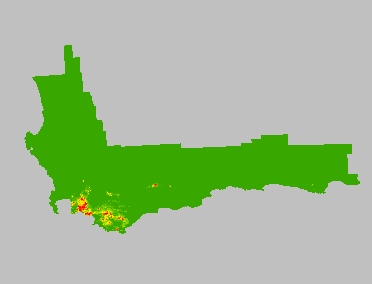
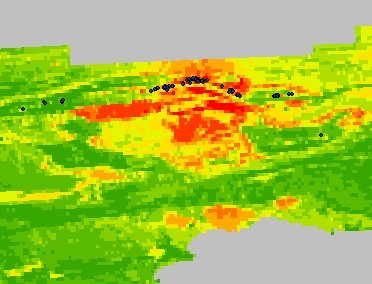
Protea coronata Comparison of Protea Atlas data and Bayesian modelling
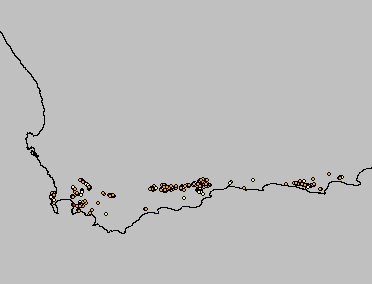
Protea coronata Protea Atlas data on its own.
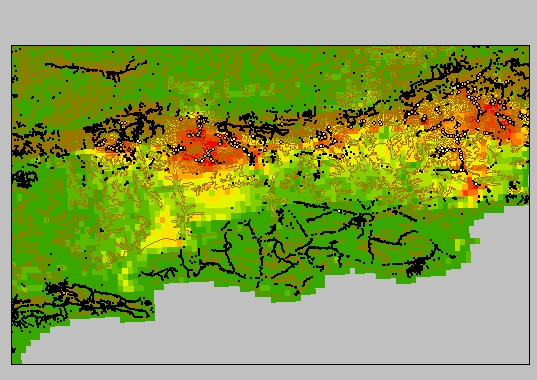
Protea coronata A closeup showing Atlas data (black dots) for Pr coronata (coloured dots) and the model predictions. Note the fits and filling in of gaps!
Protea compacta 99.0%
Protea cryophila 85.3%
Protea cynaroides 99.998% - beat that!
Protea decurrens 77.8%
Protea denticulata%
Protea effusa 87.8%
Protea eximia 99.4%
Protea foliosa 96.4%
Protea glabra 99.2% but some leakage into the Karoo
Protea holosericea 62%
Protea humiflora 97.2%
Protea inopina 28.2% - one of the worst! Not much of a prediction!
Protea intonsa 94.8%
Protea laevis 99.4%
Protea lanceolata 99.0%
Protea laurifolia 99.91%
Protea lepidocarpodendron 99.7%
Protea longifolia 99.3%
Protea lorea 76.2% - not too good! Map not too bad though.
Protea lorifolia 99.8%
Protea magnifica 93.9%
Protea montana 92.6% - something funny happened here : this cannot be Pr montana! Interestingly all the high altitude Swartberg endemics give the same problem.
Protea montana Closeup: From the Protea Atlas data the Bayesian Modelling is all wrong - any ideas?
Protea nana 91.7%
Protea neriifolia 99.6%
Protea nitida 99.86%
Protea obtusifolia 99.5%
Protea pendula 96.7%
Protea piscina 98.8%
Protea pruinosa 73.6% - not too good! Another Groot Swartbert endemic.
Protea punctata 99.97%
Protea recondita 92.9%
Protea repens 99.97%
Protea restionifolia 84.1%
Protea revoluta 96.1%
Protea rupicola 89.2%
Protea scabra 98.3%
Protea scorzonerifolia 76.7% - not too good! Map not too bad though.
Protea speciosa 99.5%
Protea scolymocephala 94.8%
Protea scolopendriifolia 97.5%
Protea scabriuscula 97.2%
Protea stokoei 56.0% - not very good! Map not too bad though.
Protea subulifolia 95.2%
Protea sulphurea 97.4%
Protea susannae 99.1%
Protea tenax 95.8%
Protea venusta 77.7% - not too good! Another Groot Swartbert endemic.
Protea vogtsiae 93.1%
Protea witzenbergiana 95.6%
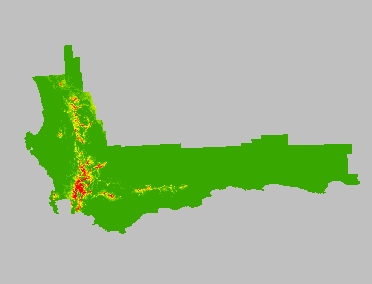
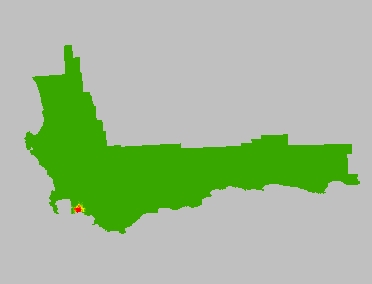
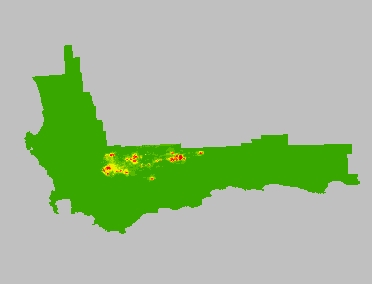
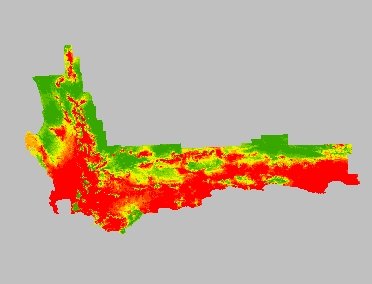
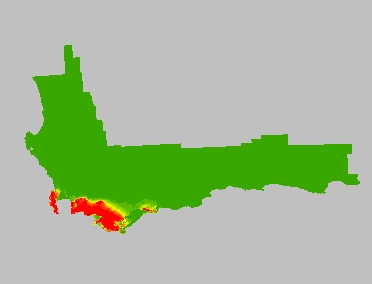
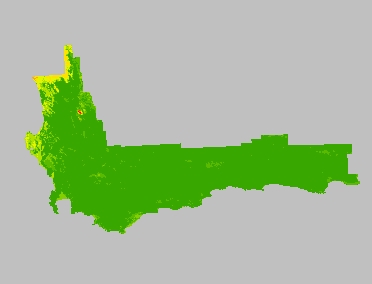
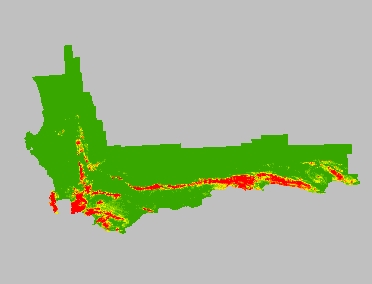
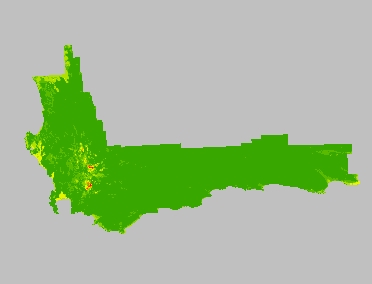
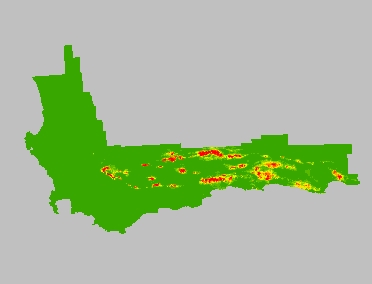
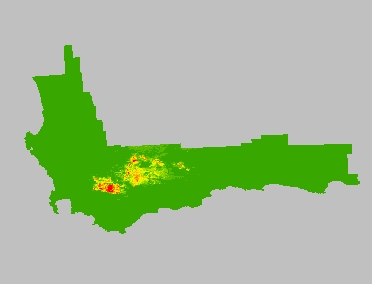
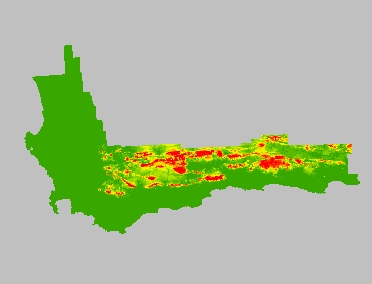
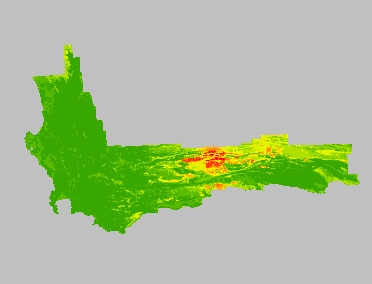
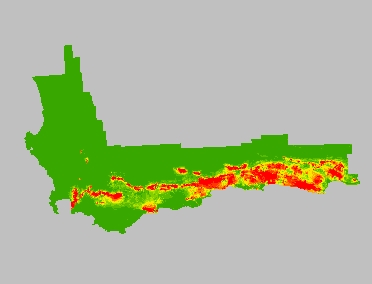
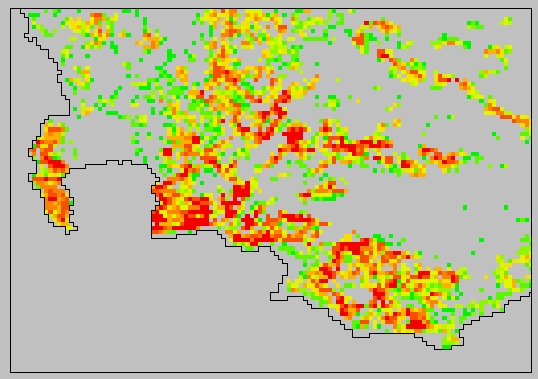
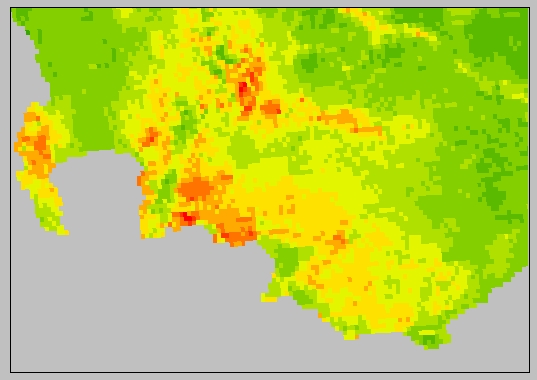
Summarizing species richness. Two maps are provided:
1. The Protea Atlas data showing richness as atlassed: this varies from 0 (no colour) through green ( = 1 species) to red ( > 18 species) to a maximum of 38 species
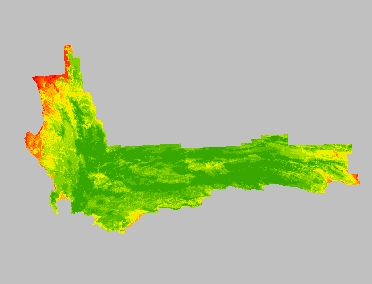
2. The Bayesian prediction showing richness obtained by summing all the probabilities for the modelled species above: This varies from a minimum of 0.75 species (green ( < 1.75 species) to 17.5 species (red > 15.8 species)
Note how the species richness is greatly exaggerated by the modelling - we may have to correct for uncertainty to get a better fit.
Back Protea Ecology