
Home
Mission
Overview of Project
Project Staff
Sponsors
Achievements
Checking, Illustrations
Upcoming Activities
Id and Species Lists
Protea Information
Protea Gallery
Growing Proteas
Interim Dist. Maps
Publications
Afrikaanse Inligting
![]()
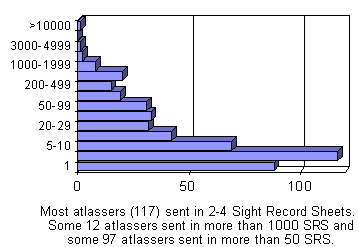
Most Sight Record Sheets (SRS)
The most important measure of effort and success is the number of locality records or
Sight Record Sheets (SRS). These are effectively points on a map. We obtained 58 811
SRS, so AGR sent in 21% and WIJ 7% of all data received. The top 10 atlassers sent in 52%
of our data.
| 12 187 AGR Atlas Grassroots Research 4 200 WIJ Ivor Jardine, Rondebosch 2 819 DOA David Osborne, Still Bay 2 300 NGF Nigel Forshaw, Oakridge 1 840 LYM Lyn McCallum, Bergvliet 1 732 OUT Outramps, Hoekwil 1 398 PVR Peter and Virginia Ross, Newlands 1 293 TLE Tom Lloyd-Evans, Dorset 1 173 SMR Ruth Smart, Wynberg 1 042 APE Atlas Project Education |
 |
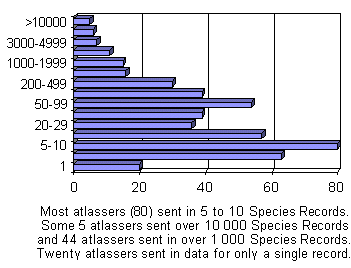
Most Species Records (Locality Records)
A secondary measure of effort and success is the number of records of species that atlassers have sent in. This is influenced by the richness of areas visited, so is not a fair measure of atlasser effort. But it is the most important measure of success in terms of the Protea Atlas Project. We obtained almost a quarter of a million records of species. A magnificent achievement!
| 46 281 AGR Atlas Grassroots Research 18 245 WIJ Ivor Jardine, Rondebosch 11 341 NGF Nigel Forshaw, Oakridge 11 228 DOA David Osborne, Still Bay 10 108 LYM Lyn McCallum, Bergvliet 8 044 OUT Outramps, Hoekwil 6 033 TLE Tom Lloyd-Evans, Dorset 5 809 PVR Peter and Virginia Ross, Newlands 5 440 APE Atlas Project Education 5 395 AWA Kitty & Austen Williams, George |
 |
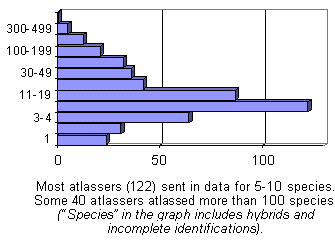
Most Species
There are 400 protea taxa - or species and subspecies - in southern Africa, including those discovered by atlassers and still awaiting description. A few additional species have escaped, bring the total to 412. Only two atlassers atlassed all of South Africa’s extant protea species, but NGF lucked out when AGR discovered a new species during the last two weeks of the project.
| 400 AGR Atlas Grassroots Research 392 NGF Nigel Forshaw, Oakridge 352 WIJ Ivor Jardine, Rondebosch 334 NAH Nick Helme, Scarborough 323 LYM Lyn McCallum, Bergvliet 321 SHR Stephen Richardson, Tamboerskloof 247 APE Atlas Project Education 233 SMR Ruth Smart, Wynberg 217 DOA David Osborne, Still Bay 216 DJL David Louw, Newlands |
 |
Highest ratio of species to SRS
These are the "species collectors", going for most species with minimum
effort. It includes people sending in primarily "special data" – rare
species and unusual occurrences - while busy with other tasks.
(Listing limited to atlassers with more than 50 SRS)
1.11 GRV Gail Reeves, Kirstenbosch
1.07 KEH Kathy Hitchings, Pinelands
1.04 EGH Ted Oliver, Kirstenbosch
1.03 MHG Moiragh Girdwood, Newlands
0.99 FWV Fritz Volk, Greyton
0.97 VDW Riaan van der Walt, Porterville
0.87 WMS Martin Scott, Oudtshoorn
0.86 CSS Craig Stobie, Observatory
0.80 EAH Ernst Hartwig, Bloubergstrand
0.76 CRS Craig Spencer, Kleinmond
Lowest ratio of species to SRS
These are the diehards! This is a measure of "staying power" – how
prepared were atlassers to continue atlassing, despite a lack of exciting new species?
However, it makes most sense for those poor highveld atlassers like the Kroons and De
Villiers who sent in over 50 SRS for just two or three species!
AGR is a "cheat" because of all his "Null SRS."
0.031 NDK Noelline & Doug Kroon, Sasolburg
0.032 JCV Johan & Christine De Villiers, Igogo
0.033 AGR Atlas Grassroots Research
0.046 MAK Dumisani Makhunga, Cascades
0.060 RHE Reuben Heydenrych, Pretoria
0.071 DDS Dawid De Swart, Bloemfontein
0.071 PSV Piet and Sonja Viljoen, Igogo
0.077 SRI Sue Rivett, Kokstad
0.077 DOA David Osborne, Still Bay
0.084 WIJ Ivor Jardine, Rondebosch
Species per Site Record Sheet
The average number of species per SRS is widely acclaimed as a measure of "quality
data." In truth, this is not so. These are the mercenaries who picked at the
‘eyes’ of the most exciting sites and areas (but often remote and hard work) and
left all the "boring" 1- and 2-species plots and species-poor areas to lesser
mortals!
The average number of species per SRS was 4.15
(Listing limited to atlassers with more than 50 SRS).
| 7.75 PAP Penny Palmer, Kleinmond 7.04 STU Michael Stroud, Bredasdorp 6.62 CJL Corey van der Laan, Somerset West 6.24 FWV Fritz Volk, Greyton 6.08 JAF James Jafta, Oudtshoorn 5.77 SHR Stephen Richardson, Tamboerskloof 5.73 ESA Booi Esau, Oudtshoorn 5.49 LYM Lyn McCallum, Bergvliet 5.32 GEH Gerard Hansford, Tulbagh 5.22 APE Atlas Project Education |
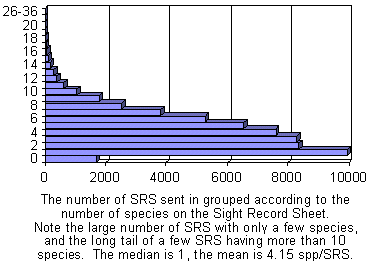 |
Although we have on average 4.15 species per SRS, this is very misleading. The above histogram shows how many SRS we have with different numbers of species. Note that more SRS with only a single species (9943) were sent in than any other number of species. "Null SRS" (1700) had no proteas. More details of these statistics follow:
Two and three page Sight Record Sheets
There were 9 lines for species on each Sight Record Sheet. Plots with more than 9 species required two pages and those with more than 18 species required three pages. No valid plots had more than 27 naturally-occurring species (or three pages). Data violating the constraints of homogeneity of habitat have not been accepted.
2862 two-page SRS were submitted.
33 three-page SRS were submitted.
1700 null page SRS were submitted. (i.e. No species)
Most species per SRS
The richest plots are listed below. These exclude planted species and "invalid
plots" (see below).
Record Localities violating the principle of homogenous landscapes were excluded from the
database.
22 HCE 960522 04 "Josephskraal –Babylonst"
21 NGF 980531 03 "Houwhoek Mt - Mt Lebanon" (incl. 1 hybrid)
21 MAJ 991113 01 "Dassenberg Lebanon SF"
20 SMR 980128 06 "Rietvlakte Houhoek Pass"
20 PVR 931002 02 "Poespas Mt Lebanon"
20 PAP 980119 04 "Heuningklip Kleinmond"
20 NGF 960706 04 "Shaws Mtn"
20 AGR Y10222 10 "Waboomsberg 4X4 Ceres" (incl. 2 hybrid taxa)
20 AGR 960401 06 "Shaws Mtn"
(There were 12 SRS with 19 species.)
The following include planted specimens (p) and escapes (e). These are plots that include protea orchards, but are otherwise natural and contain some naturally-occurring proteas. Gardens and unnatural areas are excluded.
36 AGR (30 p/e) Salmonsdam NR entrance
34 APE (32 p/e) Durbanville Nat Garden
27 ASP (21 p/e) Jutland Farm Ariskraal
26 LYM (18 p) Elandskloof Louwshoek
24 LYM (19 p) Durbanville Nat Garden
23 AGR (10 p/e) Villiersdorp Bot Garden
23 AGR (18 p) Durbanville Nat Garden
23 AGR (11 p) Salmonsdam NR
21 AGR (9 p) Depoortvandutoitskloof
The number of SRS sent in grouped according to the number of species on the Sight Record Sheet. Note the large number of SRS with only a few species, and the long tail of a few SRS having more than 10 species. The median is 1, the mean is 4.15 spp/SRS.
Most hybrids
One of the Protea Atlas Project’s major contributions was to document the diversity and abundance of natural hybrids between protea species. We found 250 different crosses amounting to 810 records of hybrids.
103 AGR Atlas Grassroots Research
42 NGF Nigel Forshaw, Oakridge
41 WIJ Ivor Jardine, Rondebosch
35 LYM Lyn McCallum, Bergvliet
32 SMR Ruth Smart, Wynberg
24 ASP Atlas Special Projects
22 APE Atlas Project Education
22 AMM Adrian Mohl, Bern
20 GED David Gwynne-Evans, Claremont
17 DOA David Osborne, Still Bay
17 AJT Andrew and Eve Tiltman, Pinelands
The richest grid squares
The richest site (or Sight Record Sheet) had 22 species and was atlassed at Josephskraal in the foothills just west of the Babylonstoring Mountains.
Data are still being processed so we do not have data at many other scales.
At the 12km X 12 km grid scale the richest site is 3319 CDC Villiersdorp with 75 species. The second richest site is 3419 ACA Kleinmond with 70 species. The richest site known when the Protea Atlas Project began in 1991 was 3419 AAD Houwhoek, which currently has 68 species, tying for third place with 3418 BDB Hangklip.
First and last species in data base
The first processed species – and hence the top record in our Protea Atlas Data Base is Protea nitida, atlassed in by Richard Cowling in December 1991 at Coutjieskraal in the Baviaanskloof.
The last legitimate record received was of Se adscendens atlassed by Molly Wilson in November 1995 at Onrust.
The first date for which we have data is 24 August 1991, when Atlas Project Education did its first training course. Some 8 atlassers collected data on the last legitimate day of 31 March 2001. They were (in order of data received): Ivor (WIJ), Tony (AGR), Nigel (NGF), Tom (TLE), Simon (SGA), Pindar (PIN), Outramps (OUT), Johan & Christine (JCV).
How well have we done?
Top 50 species by Number of Record Localities
| 22322 Ld sgnm 14303 Pr repe 10169 Pr laur 8546 Pr niti 8032 Pr cyna 6823 Ld xant 6377 Mi cucu 6069 Pr neri 5184 Ha seri |
4802 Pr lori 4789 Ld euca 4171 Ld rubr 3812 Ld pube 3479 Pr acau 3395 Ld laur 3200 Ls cono v 3116 Ls cune 3001 Ld spiss |
2815 Se fasc 2541 Au umbe 2513 Pr caff c 2497 Pr exim 2223 Ls call 2205 Pr punc 2103 Pr scbr 1943 Pr lepi 1941 Ls witt |
1650 Ld gand 1636 Ld sflm 1566 Pr roup r 1532 Se elon 1524 Pr long 1512 Mi fimb 1343 Ld meri 1297 Di diva d 1294 Ld glab g |
1273 Pr obtu 1237 Br stel 1230 Pr spec 1173 Pr srfl 1171 Ld tere 1152 Fa sali 1140 Ld arcu 1130 Pr ampl 1103 Pr cpct |
1064 Pr magn 1050 Ls cflm 1049 Pr glab 996 Pa disp 984 Ld micr |
Number of record localities listed. Some way points for reference: 38% of the 58 811 Record Localities contain Ld salignum, 15% have Pr nitida, 9% have Ha sericea, 4% have Pr caffra, and 2% have Pr glabra.
Top 20 most-atlassed species by number of atlassers who have recorded species
| 295 Ld sgnm 257 Pr repe 208 Pr niti 208 Pr cyna |
173 Pr laur 169 Pr neri 168 Mi cucu 154 Ld rubr |
138 Ha seri 137 Ld xant 137 Pr acau 135 Pr lori |
128 Pr exim 126 Ld euca 126 Ls cune 125 Ls call |
121 Ld laur 119 Ls cono v 118 Se fasc 118 Pr caff c |
113 Ld spiss 102 Pr punc |
Numbers of atlassers listed. Some way points for reference: We have 478 atlassers, so 60% of them atlassed Ld salignum, 30% Ha sericea, and 25% Pr caffra.
| 74 Ld gandogeri X xanthoconous 63 Se glomerata X villosa 47 Pr pendula X witzenbergiana 34 Ls hypophyllocarpodendron X parile 33 Pr burchellii X laurifolia 21 Ld coniferum X xanthoconus |
18 Pr caffra X simplex 15 Ls rodolentum X tomentosum 14 Pr laurifolia X magnifica 13 Ld laureolum X xanthoconus 11 Ld gandogeri X laureolum 11 Ls hypophyllocarpdondendron X rodolentum |
10 Pr glabra X nitida 10 Pr longifolia X repens 9 Ls pedunculatum X truncatulum 9 Pr punctata X venusta 8 Ld laxum X modestum 8 Pr caffra X welwitschii 8 Pr longifolia X neriifolia |
Numbers of record localities listed. X signifies "cross" or hybrid. We recorded some 251 different crosses or hybrids.
| 1 Ld climacticum 5 Ld comosum homaeophyllum 5 Pr nubigena 5 Pr roupelliae hamiltonia 5 Se pinnata 5 So palustris 5 Ve latebrosa 7 Ls harpagonatum |
7 Pr asymmetrica 7 So crassifolius 9 Pr dracomontana inyanganiensis 9 Pr enervis 10 Se confragosa 10 So alopecuroides 10 Sp tulbaghensis 12 Pr wentzeliana |
12 Se zeyheri 13 Ls tottum glabrum 14 Ls linearis calocephalum 14 Se aemula foeniculacea 14 So clavigerus 14 Sp salsoloides |
Numbers of record localities listed. Records for So palustris may be incorrectly identified So clavigerus.
Ld grandiflorum
Ld spirale
Se aemula congesta
Se furcellata (sensu strictum)
All four of the above unatlassed species are presumed extinct.
Histogram of the number of species that have been atlassed in various classes.
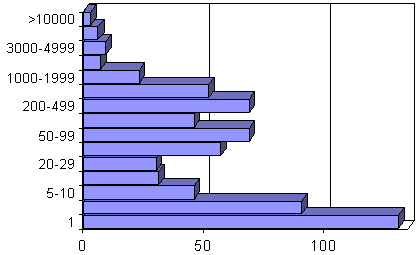 |
Three species were atlassed more than 10 000 times. The large number of species atlassed only once (131) or 2-4 times (89) are largely hybrids – see the "Tail-enders" above. Only a handful of protea species have more than 100 herbarium specimens worldwide! |
Back PAN 51