Home
Mission
Overview of Project
Project Staff
Sponsors
Achievements
Checking, Illustrations
Upcoming Activities
Id and Species Lists
Protea Information
Protea Gallery
Growing Proteas
Interim Dist. Maps
Publications
Afrikaanse Inligting
![]()
Record Months

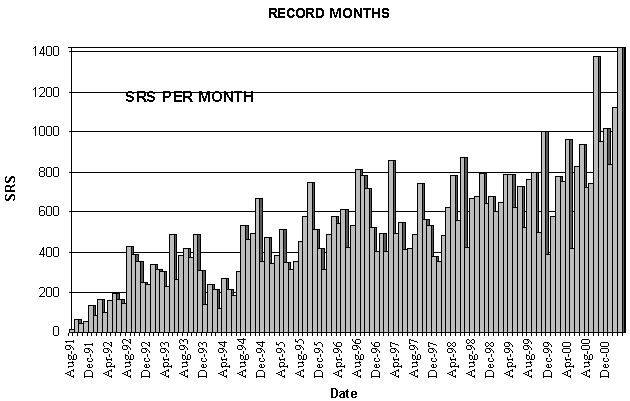
There has been a steady increase of data income over the 9.5 years from 14 SRS in August 1991 to 1420 SRS in March 2001. The record months are:
|
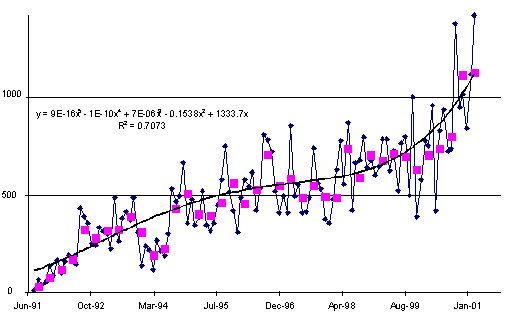
The Protea Atlas Project showed linear growth from its start until December 1993. Had this growth been sustained we would have had about 1 500 SRS per month at the close of he project. A stable rate of data input at about 500 SRS per month occurred from July 1994 to April 1998, after which it increased to stabilize at between 600-700 SRS per month. A target of 800 SRS per month was always maintained as the break-even point – the rate at which the employment of the co-ordinator and secretary would be justified purely in terms of data income (excluding publicity and extension). From June 2000 the rate started increasing, peaking at an average of 1 100 SRS/month for the last two quarters. Note that this is not the same as the rate of data received at the office – we processed almost 2 500 SRS in the two months after the project officially ended, some of it dating back to 1995. |

Tony Rebelo
Back PAN 51