![]()
Home
Mission
Overview of Project
Project Staff
Sponsors
Achievements
Checking, Illustrations
Upcoming Activities
Id and Species Lists
Protea Information
Protea Gallery
Growing Proteas
Interim Dist. Maps
Publications
Afrikaanse Inligting
![]()
Comments wanted on Protea Atlas
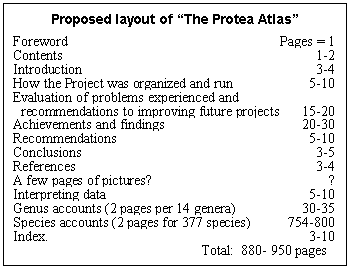
![]() On the next two pages are
layouts for the "The Atlas." There is unfortunately not space for everything.
For instance, at two pages per 370 species we already need 740 pages. That is a huge tome.
Given an introduction, genus introductions, how the atlas worked, highlights, findings,
suggestions for future atlassers, etc. we will need another 50-120 pages. This is
really stretching the limits for a single volume. But two volumes will probably be far too
expensive (we will explore it though).
On the next two pages are
layouts for the "The Atlas." There is unfortunately not space for everything.
For instance, at two pages per 370 species we already need 740 pages. That is a huge tome.
Given an introduction, genus introductions, how the atlas worked, highlights, findings,
suggestions for future atlassers, etc. we will need another 50-120 pages. This is
really stretching the limits for a single volume. But two volumes will probably be far too
expensive (we will explore it though).
So there is only space for one map and two diagrams per species (these will be the flowering and growth histograms).
All the other information will have to be descriptive (but will be available as histograms on the CD). The question is how to describe it. We must include the sample, and the proportions per category for every field on the SRS form. (Dare we leave some out?). At this stage we are suggesting the following format:
Landform: Out of 751 records, 82% were found in Deep Soil, 16% in Shallow Soil, 2% in Rocky Outcrop, and 0.1% in Swamp.
Note:
- Fields not used (e.g. Lake Edge) are left out.
- Fields are listed in order of importance.
- We have included all used fields, not just the top few.
- We have chosen a readable format, rather than a tabulated or a summarized format such as:
Landform: (751) DS: 82%, SS: 16%, RO: 2%, SW: 0.1%
Your comments and ideas please.
Maps
What cannot be seen in the pages overleaf is that we want to have the distributional data and histograms in a red spot colour. We will have different shading dots for eXtinct, Scarce, Frequent, Common and Abundant. Shown in the maps overleaf are also all the atlas localities. We will probably leave these out of "The Atlas," as the clutter they produce is more distracting than the benefit of showing what areas were sampled. You will be able to see this on the CD version accompanying the volumes, by selecting the correct themes (data sets) in ARC-EXPLORER.
We will not have the same map for each species, but have different maps, as we have had in the past Interim Distribution Maps. – If you want standardized maps then please buy SASOL Proteas 2! However, we will have latitude, longitude and the scale clearly marked on the maps. Should we include a small orientation_map (e.g. like those in SASOL 2) within the map to guide orientation?
Your comments and ideas please.
Histograms of Flowering and Growth
The histograms will be for 18 months, starting in January and ending in June. This will allow both summer and winter trends to be clearly visible. The top categories (Flowering, Over & Bud and Much) will be in red, and the other categories (Cone & Peak and Rare) will be in black, with Nothing shown as blank. Sample sizes per month will also be shown.
On the CD, a more expansive colour set will be available to view the same data. You will be able to alter and choose your own format, colours and fonts for the histograms.
Your comments and ideas please.
Other information
In addition to the details on the SRS, we will include some relevant Additional Remarks Box data, including pollinator details. These will be edited and adjusted to make it readable and in context. We will not reference the comments in "The Atlas." However, in the CD an unedited version will be available with the author’s credits and dates (but as the Observer Code, date and number for day).
Your comments and ideas please.
Distributional Summary
This will be a descriptive summary of the following points:
Problems in identifying and mapping the species:
- How distinct is the species?
What is it easily confused with?
What was it confused with?
How reliable are the data shown? - What identification problems were encountered by atlassers? (hybrid swarms, distinct
populations, unusual populations, clines - where species change from one form to another
over a gradient)
Is more taxonomic work on the species indicated?
Distribution of the species:
- Where does the species occur?
- What range extensions gaps did we find?
- Where did atlassers not find it based on herbarium data? Is it extinct there?
I had hoped to model the data and provide – in the CD version– a map of where the species probably occurs. In other words, filling in the gaps between where we atlassed. This is being computed by our USA Bayesian team. We can also do it using Generalized Linear Modelling, but this will take 1-3 days per species. Unfortunately, this information will not be ready in time.
Your comments and ideas please.
There is just enough time for you to comment before the December Newsletter, in which I
will summarize the ideas presented, extract the workable options and ask for consensus and
a vote. So if you want to contribute to the layout of your Atlas, you have yet another
chance.
Back PAN 52