![]()
Home
Mission
Overview of Project
Project Staff
Sponsors
Achievements
Checking, Illustrations
Upcoming Activities
Id and Species Lists
Protea Information
Protea Gallery
Growing Proteas
Interim Dist. Maps
Publications
Afrikaanse Inligting
![]()
Latest Developments in the Protea Atlas Project
Bayesian Modelling
Species Modelling
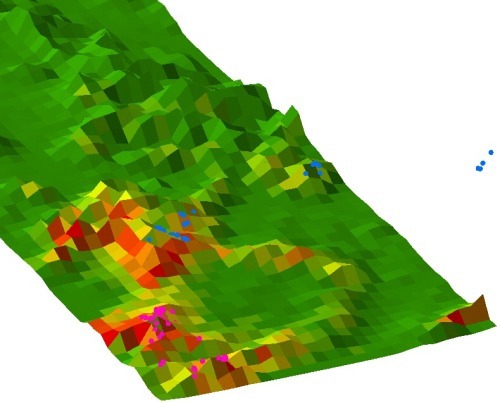 Model of predicted presence (as probabilities, red ) 0.8, green ( 0.05) of Mimetes arboreus (pink dots). Note the ghosting effect which approximates the presence of
Mimetes argenteus (blue dots), its sister species. This pattern repeats itself with other congeners (e.g. modelling
Leucospermum bolusii gives the combined distribution range of Leucospermum
bolusii and Leucospermum truncatulum). This suggests that some sister species are dividing up the same niche geographically. Consequently, a phylogenetic component will be included in the next phase of the model to tease out which clades are subdividing the niche, and which have diverged into different niches.
Model of predicted presence (as probabilities, red ) 0.8, green ( 0.05) of Mimetes arboreus (pink dots). Note the ghosting effect which approximates the presence of
Mimetes argenteus (blue dots), its sister species. This pattern repeats itself with other congeners (e.g. modelling
Leucospermum bolusii gives the combined distribution range of Leucospermum
bolusii and Leucospermum truncatulum). This suggests that some sister species are dividing up the same niche geographically. Consequently, a phylogenetic component will be included in the next phase of the model to tease out which clades are subdividing the niche, and which have diverged into different niches.
(DNA for over 200 species have been sampled - we hope to sample all extant species this year)
Bayesian Modelling
Richness Modelling
 Distribution of species richness predicted from the models. This is based on 23 species (out of 160 - chosen non-randomly for different life history characteristics) of Proteaceae. The highest richness predicted was 9 species per minute by minute cell (the highest known richness is 23). Despite being biased and undersampled, the pattern is remarkably close to that expected. These are preliminary data - geology and ruggedness have not yet been incorporated into the model: We assume that including these variables will refine model even more.
((Richness has been modelled integrally as part of the species modelling. Richness here is simply the sum of probabilities of all species for any cell.))
Vegetation Map
Delimiting Units
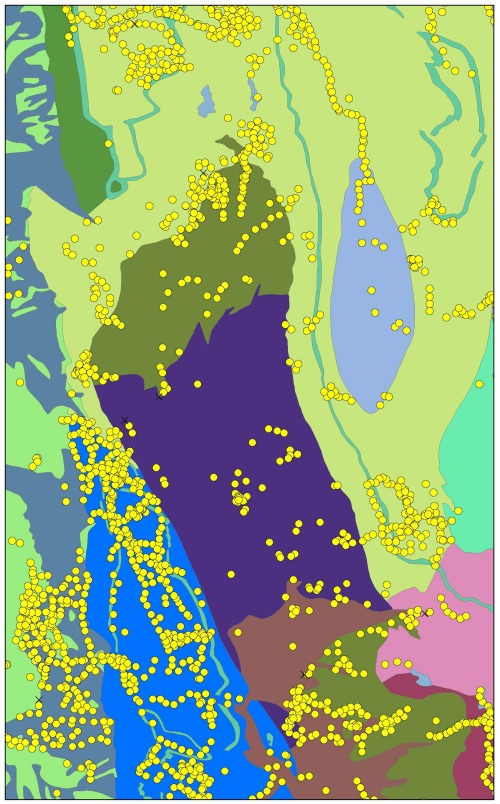 The Protea Atlas Project data have been invaluable in the new Vegetation map. The distribution of proteas has shown cut-off points in Proteoid and Ericoid Fynbos along climatic/altitudinal/geological gradients. Satellite data are confounded by aliens and veld age. Phytosociological and structural data are far too sparse to map communities. With over 250 000 records for over 60 000 localities, PAP data have enabled a far more detailed map than previously possible. Ground truthing is still required as many of the new vegetation map units only have Protea data! The area shown is the upper Worcester Valley and surrounding mountains and focuses on areas previously regarded to be Renosterveld, but shown to be full of proteas – i.e. Proteoid
Fynbos.
The Protea Atlas Project data have been invaluable in the new Vegetation map. The distribution of proteas has shown cut-off points in Proteoid and Ericoid Fynbos along climatic/altitudinal/geological gradients. Satellite data are confounded by aliens and veld age. Phytosociological and structural data are far too sparse to map communities. With over 250 000 records for over 60 000 localities, PAP data have enabled a far more detailed map than previously possible. Ground truthing is still required as many of the new vegetation map units only have Protea data! The area shown is the upper Worcester Valley and surrounding mountains and focuses on areas previously regarded to be Renosterveld, but shown to be full of proteas – i.e. Proteoid
Fynbos.
Vegetation Map
Discovering Fynbos
 As a consequence of delimiting Fynbos boundaries more precisely, the Protea Atlas Project has also allowed the prediction of gaps in our knowledge of where Fynbos occurs. The old vegetation map (Low and Rebelo) is shown on top with the new vegetation map (in progress) shown below, for the western Little Karoo from Hex River to Garcias Pass. Some field truthing has revealed previously unsuspected range extensions in the Kango and Barrydale areas. Larger expanses of previously unsuspected Fynbos in the Touwsrivier and Anysberg Little Karoo were well atlassed during the project. On the whole though we have sampled most areas adequately. Note the detail we have been able achieve, partially due to Protea Atlas data. More null data are required though for Bayesian
modelling.
As a consequence of delimiting Fynbos boundaries more precisely, the Protea Atlas Project has also allowed the prediction of gaps in our knowledge of where Fynbos occurs. The old vegetation map (Low and Rebelo) is shown on top with the new vegetation map (in progress) shown below, for the western Little Karoo from Hex River to Garcias Pass. Some field truthing has revealed previously unsuspected range extensions in the Kango and Barrydale areas. Larger expanses of previously unsuspected Fynbos in the Touwsrivier and Anysberg Little Karoo were well atlassed during the project. On the whole though we have sampled most areas adequately. Note the detail we have been able achieve, partially due to Protea Atlas data. More null data are required though for Bayesian
modelling.
Climate modelling
Future Prognosis
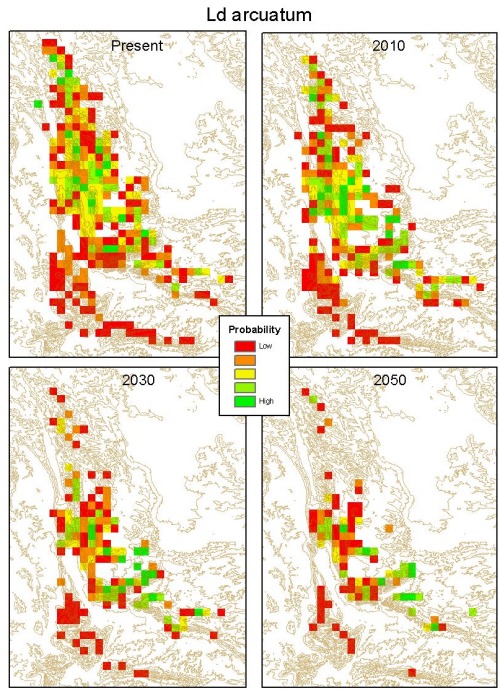 The Climate Modelling Team at NBI are using Protea Atlas data to model the distribution of proteas using General Additive Models. This allows a prediction of the future distributions of proteas based on the predicted changes in climate over the next 50 years. Most species have already been modelled. When completed we will be able to determine what proportion of species will be strongly or weakly affected or unaffected by predicted climatic change, and the ecological traits of species in these groups.
Conservation Planning
 Protea Atlas Data were been used by CAPE as one of the data layers to determine a conservation network for the Fynbos Biome (using C-plan). Using predicted changes in distribution we can determine the long-term effectiveness of these options under climate change scenarios. Shown are Protea Atlas data from the Kogelberg area, showing areas under various conservation strategies and those lost due to transformation by agriculture, afforestation and urbanization.
Red Data List
Assigning Red Data Book Status
 Areas of occurrence and occupancy have been worked out for all species. We are calculating areas lost to transformation. These will allow us to computationally assign New IUCN Red Data List status to proteas based on Criteria A1C (Population reduction in terms of decline in area) and B (Extent of occurrence or occupancy). Data on criteria C & D (Population size) are already in the Protea Atlas database. In conjunction with Climate Modelling we will infer E (Probability of extinction). If you want to help in evaluating these Red Data Book assessments, please email
protea@nbict.nbi.ac.za. The map shows an example of the data for
Diastella buekii in its distribution in the Franschhoek valley. It will be assigned Critically Endangered because 80% of its area of occupancy and 80% of its area of occurrence have been lost to agriculture and afforestation.
Areas of occurrence and occupancy have been worked out for all species. We are calculating areas lost to transformation. These will allow us to computationally assign New IUCN Red Data List status to proteas based on Criteria A1C (Population reduction in terms of decline in area) and B (Extent of occurrence or occupancy). Data on criteria C & D (Population size) are already in the Protea Atlas database. In conjunction with Climate Modelling we will infer E (Probability of extinction). If you want to help in evaluating these Red Data Book assessments, please email
protea@nbict.nbi.ac.za. The map shows an example of the data for
Diastella buekii in its distribution in the Franschhoek valley. It will be assigned Critically Endangered because 80% of its area of occupancy and 80% of its area of occurrence have been lost to agriculture and afforestation.
Back Protea Atlas Project