Home
Mission
Overview of Project
Project Staff
Sponsors
Achievements
Checking, Illustrations
Upcoming Activities
Id and Species Lists
Protea Information
Protea Gallery
Growing Proteas
Interim Dist. Maps
Publications
Afrikaanse Inligting
![]()
Bayesian Modelling of the Protea Atlas Data
The latest predictions (May 2005) of where Proteas may grow using Bayesian modelling have been completed.
Tony Rebelo, Walter Smit and Gail Reeves recently visited the United States for discussions on the Bayesian Modelling of the Protea Atlas data.
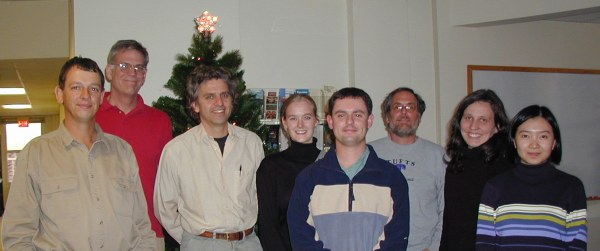
The Bayesian Macro-Ecology Team at a meeting in Santa Barbara 6-11 December 2001 at the National Centre for Ecological Analysis and Synthesis

Tony Rebelo (Protea Atlas Project, National Botanical Institute), John Silander (Dept Ecology and Evolutionary Biology, Univ Connecticut), Henri Laurie (Dpt Applied Maths, Univ Cape Town), Gail Reeves (Leslie Hill Molecular Systematics Laboratory, National Botanical Institute), Walter Smit (Protea Atlas Project, National Botanical Institute), Alan Gelfand (Dpt Statistics, Univ Connecticut), Alexandra Schmidt (Dpt Statistics, Univ Connecticut), Shanshan Wu (Dpt Statistics, Univ Connecticut).
Not Present - Richard Cowling (Dept Botany, Univ Port Elizabeth), Andrew Latimer (Dept Ecology and Evolutionary Biology, Univ Connecticut), Paul Lewis (Dept Ecology and Evolutionary Biology, Univ Connecticut).
John is heading the Working Group, Alan is the brains behind Bayesian Modelling and Alex and Shanshan are writing the programmes that do the Bayesian modelling. Tony and Walter are working up the Protea Atlas Project and Gail is doing DNA sequencing of the proteas.
Have a look at University of Connecticut and National Centre for Ecological Analysis and Synthesis.
Predictions of the Bayesian Modelling Exercise

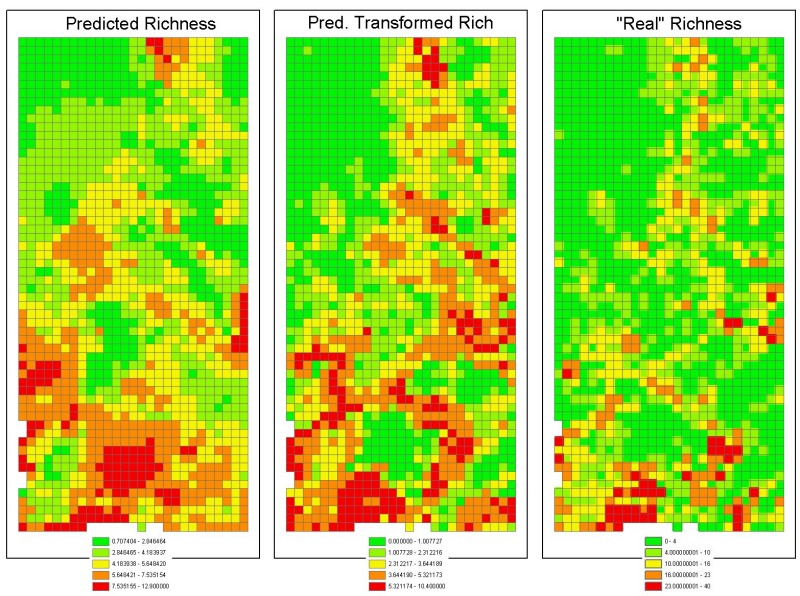
Here are the predictions of the Bayesian modelling exercise on the protea species richness of the Kogelberg-Hawequas area. They are: (left) The actual predictions based on what species richness should be in a pristine environment. The richest cell has 13 species. (centre) What we currently see due to transformation of the land by man (chiefly agriculture, afforrestation, urbanization anda aliens. The richest cell has 10 species. (right) Actual species richness (out of 160 species). The richest cell has 40 species.
Notes
1 We have not yet included geology in the model. Geology should be
strongly correllated with transformation, so that our actual prediction should
closely resemble the richness due to transformation (centre). Our
prediction due to transformation would then be far less different from from the
actual within the mapped area.
2. We have only modelled 20 out of 160 species. These species were chosen non-randomly to give us a fair spread of species with different types of ranges and different ecologies. Thus the relationship between the pattern seen and the actual is very remarkable. However, extrapolation suggests that our model is predicting 10*20/160 = 80 species in the richest cells, which is out by a factor of 2. This may be because we have not modelled the rarest species, but this cannot explain the magnitude of the error in highest richness.
3. The cut-off levels for each map was computed automatically as the natural breakpoints. Altering these would change the visual extent of the patterns, but not the patterns themselves. No attempt has been made to match the relative contributions of each level across the different maps.
Back Protea Atlas Project